
Canacol’s ESG Milestones in 2019
Social Performance
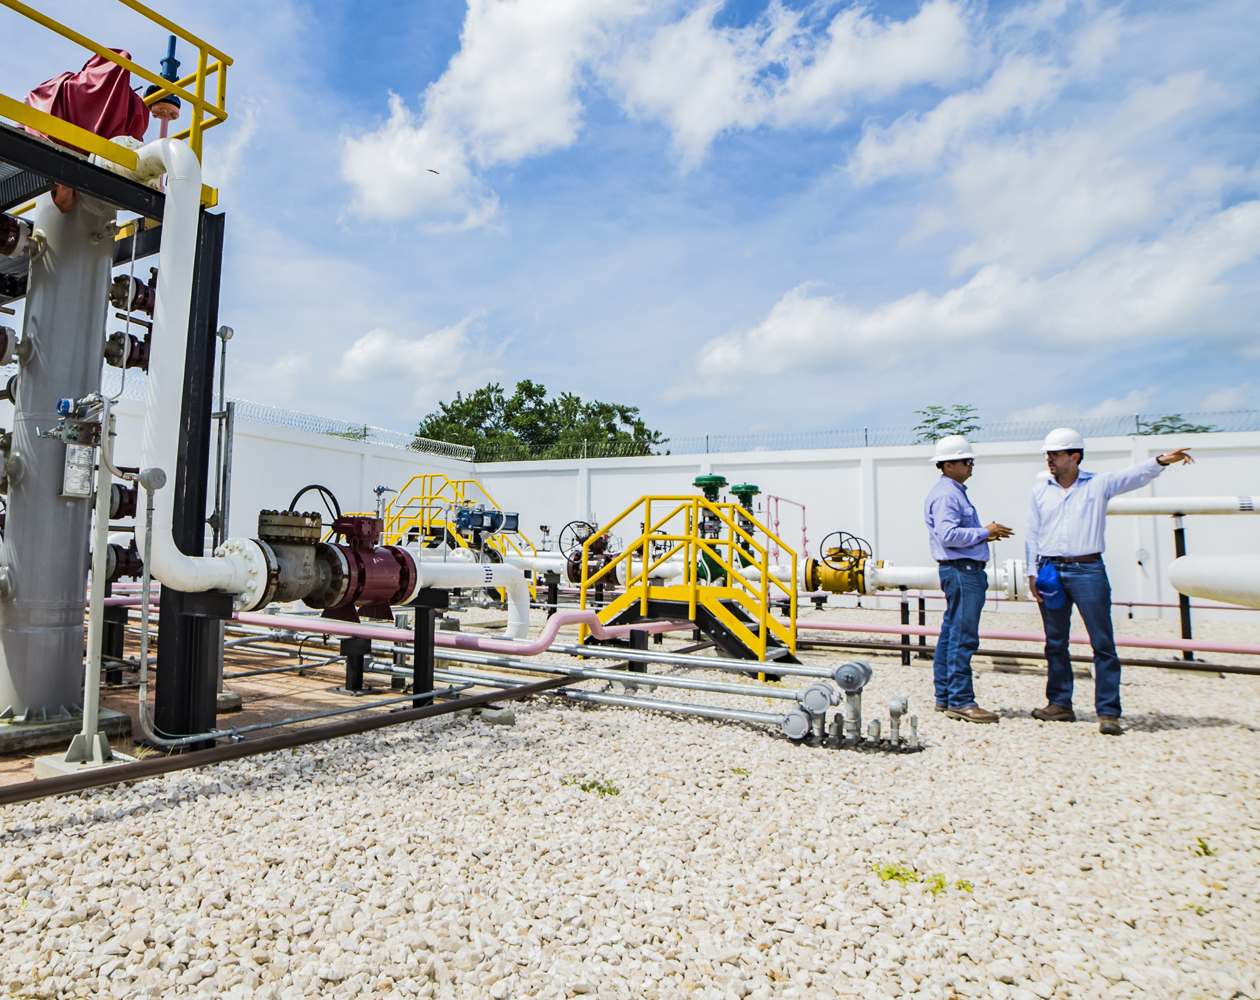
Environmental Performance
Corporate Governance Performance
Overall Performance
| Concept | 2017 | 2018 | 2019 | Variation % |
|---|---|---|---|---|
| Employees | 322 | 300 | 405 | 35.0% |
| Employees by Gender (Number) | W 122 / M 200 | W 119 / M 181 | W 188 / M 217 | W 58.0% / M 19.9% |
| Employees by Gender (W%) (M%) | W 37.9% / M 62.1% | W 39.7% / M 60.3% | W 46.4% / M 53.6% | W +6.7% / M -6.7% |
| Officers by Gender (W%) (M%) | W 30.3% / M 69.7% | W 26.9% / M 73.1% | W 28.8% / M 71.2% | W +1.9% / M -1.9% |
| Investment in Training (USD) | $46,780 | $159,378 | $377,055 | 136.6% |
| Lost-time injuries frequency rate (LTIFR) 1 | 2.69 | 1.08 | 2.29 | 112.0% |
| *Total Recordable Injury Frequency Rate TRIR 1 | 2.69 | 1.08 | 2.62 | 242.6% |
| **Severe Vehicle Incident Frequency Rate SVIR 1 | 0.33 | 0.00 | 0.00 | 0.0% |
| Natural Gas Production (BOE / Day) | 13,765 | 19,667 | 25,100 | 27.6% |
| 2P Gas Reserves (MBOE) | 88.6 | 98.1 | 109.4 | 112% |
| CAPEX (Millions of USD) | $121.2 | $127.6 | $100.5 | -21.2% |
| Economic Value Generated (Millions of USD) | $251.2 | $251.1 | $278.1 | 10.8% |
| Economic Value Distributed (Millions of USD) | $255.0 | $275.6 | $255.0 | -7.5% |
* In 2019 Canacol achieved its second consecutive year without an employee recordable incident and is focused on continuing this trend. Our primary metric, however, is total TRIR trend including contractors which remains well below industry average. It is worth noting that 2019 included a 35% increase in hours worked/exposure to risk involving primarily unskilled labor associated with the Guacharaca seismic survey.
**For the SVIR indicator, the company has performed satisfactorily with 0 accidents for two consecutive years, exceeding the established goal.
1. The calculation of the accident rate indicators takes into account the constant of 1,000,000 hours worked. These indicators include employees and contractors.
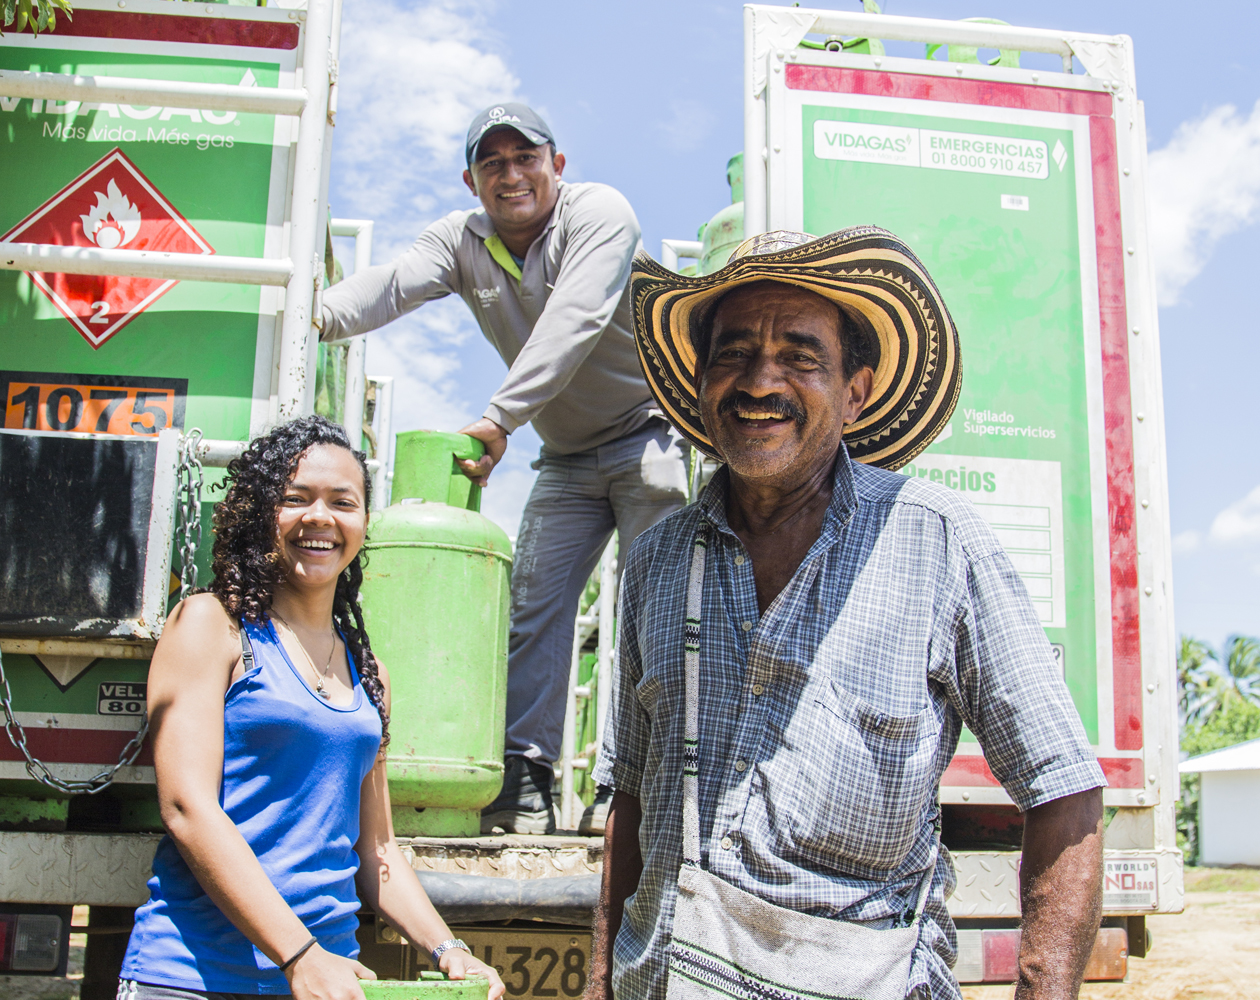
Social Performance
| Concept | 2019 |
|---|---|
| Social Investment in Neighboring Communities (Millions of USD) | 7.2 |
| Number of people benefited by program 2 | 2019 |
|---|---|
| Gas Supply for Domestic Use | Approximately 40,000 beneficiaries in 150 communities |
| Strengthening of Local Institutions | |
| Increasing access to and quality of primary and secondary education | |
| Potable Water Access | |
| Fostering Entrepreneurial Projects | |
| Public Infrastructure Improvements | |
| Humanitarian Aid |
2. An approximate is used for all programs since some families are beneficiaries of 1 or 2 or more projects.
Environmental Performance
| Concept | 2019 |
|---|---|
| Environmental investment (Millions of USD) | 2.7 |
| Number of fines and penalties due to non-complience of environmental laws | 0 |
| Fines and penalties value due to non-complience of environmental laws (USD) | 0 |
Note: Environmental spending is typically driven by block/contract phase requirements as either a precursor to activity or in conjunction with development operations.
Corporate Governance Performance
| Concept | 2017 | 2018 | 2019 | Variation % |
|---|---|---|---|---|
| Number of Members of the Board of Directors | 7 | 7 | 7 | 0% |
| Independent Board Members (%) | 71.4% | 71.4% | 71.4% | 0% |
| Number of Committees supporting the Board of Directors | 4 | 3 | 4 | 33% |
| Percentage of Independent Board Members who chair Committees | 71.4% | 71.4% | 71.4% | 0% |